The challenge of higher prices is starting to weigh on home sales. New and existing home sales both dipped last month while the median price of existing homes sold topped $350,000 for the first time. Vacation home sales jumped 57.2% over the last year.
Key Points for the Week
- New and existing home sales fell 5.9% and 0.9% respectively as higher prices slowed purchases.
- The U.S. Personal Consumption Expenditures (PCE) inflation index rose 3.9% as expected, up from 3.6% in April. Core PCE inflation rose 3.4%.
- Increased employment pushed employee compensation 0.7% higher as more states reopened parts of the economy and wage pressures remained high.
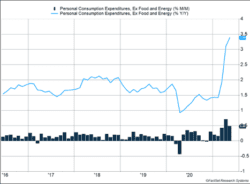
Increased demand and slow-to-recover supply continue to pressure prices. The PCE inflation index jumped 3.9%, and core inflation rose 3.4% last month (Figure 1). Employee compensation rose 0.7% while disposable income dropped 2.3%. As pandemic-related support programs are reduced or expire, more income will need to come from employment to support current spending trends.
Stocks rallied after the previous week’s decline of less than 2%. The S&P 500 jumped 2.8%, more than making up for the loss. The gains pushed the index of large U.S. stocks to an all-time high. The MSCI ACWI gained 2.3%. The Bloomberg BarCap Aggregate Bond Index declined 0.4%.
June’s employment data will be the key economic report for the week. After missing estimates in recent months, the report will gauge whether workers are returning to jobs as states continue to reopen.
Figure 1
Economic Transitions
The U.S. economy is transitioning from sustaining itself during a pandemic to relying on job growth and salaries to expand in future quarters. The economic progress from the pandemic has been strong. Because of government programs, people were able to stay in their houses, make credit card payments, and generally deal with any temporary job losses. The results of this decline compare favorably with how well the U.S. bounced back from the global financial crisis.
As the economy reopens, some policies may need to be adjusted or allowed to expire to keep the recovery on track and prevent imbalances in the economy.
Imbalances can show up in several ways, including in inflation data. Core PCE inflation, which excludes food and energy, is up 3.4% over the last year. The Federal Reserve has communicated it would like to see higher inflation; yet, these increases are greater than expected or desired. As we noted last week, the results caused Fed officials to move up the date when monetary policy would start to tighten.
A shortage of semiconductor chips has pushed up the prices of automobiles and may be affecting other areas as well. It also appears likely an imbalance between resurgent demand and labor supply is contributing to increased prices.
The programs designed to support people during the pandemic created an interesting dynamic in which people were taking in higher levels of income without working. By not working, they curtailed supply in some industries. Because income was strong, they were spending more than normal. Personal consumption is up 18.9% over the last year, and it is 5% higher than it was prior to the pandemic. When demand increases faster than supply, inflation is a natural outcome.
As additional unemployment benefits and other assistance continue to expire in various states, hopes are this will push employment higher and expand the supply in some businesses that have not been able to serve as many customers due to labor shortages. Employee compensation grew 0.7% last month, and this measure is a better gauge of the recovery than disposable income, which includes government benefits.
A stronger recovery hinges on better job growth. On Friday, the government will release its monthly employment update. Economists are expecting approximately 700,000 net new jobs. These and data that shows whether wages are rising too quickly will be key points to indicate how well the economy is bouncing back from its pandemic-led decline.
—
This newsletter was written and produced by CWM, LLC. Content in this material is for general information only and not intended to provide specific advice or recommendations for any individual. All performance referenced is historical and is no guarantee of future results. All indices are unmanaged and may not be invested into directly. The views stated in this letter are not necessarily the opinion of any other named entity and should not be construed directly or indirectly as an offer to buy or sell any securities mentioned herein. Due to volatility within the markets mentioned, opinions are subject to change without notice. Information is based on sources believed to be reliable; however, their accuracy or completeness cannot be guaranteed. Past performance does not guarantee future results.
S&P 500 INDEX
The Standard & Poor’s 500 Index is a capitalization-weighted index of 500 stocks designed to measure performance of the broad domestic economy through changes in the aggregate market value of 500 stocks representing all major industries.
MSCI ACWI INDEX
The MSCI ACWI captures large- and mid-cap representation across 23 developed markets (DM) and 23 emerging markets (EM) countries*. With 2,480 constituents, the index covers approximately 85% of the global investable equity opportunity set.
Bloomberg U.S. Aggregate Bond Index
The Bloomberg U.S. Aggregate Bond Index is an index of the U.S. investment-grade fixed-rate bond market, including both government and corporate bonds.
https://www.nar.realtor/newsroom/existing-home-sales-experience-slight-skid-of-0-9-in-may
https://www.census.gov/construction/nrs/pdf/newressales.pdf
https://www.bea.gov/news/2021/personal-income-and-outlays-may-2021
Compliance Case # 01069990


