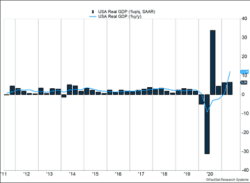
Supply chain issues continued to constrain economic growth and housing. U.S. GDP grew 6.5% in the second quarter, falling 2.0% short of expectations. Strong consumer demand created a surge in purchases. Production didn’t match demand, and the corresponding drop in inventories robbed more than 1% of GDP growth. Housing demand slowed as well last month. Shortages of appliances along with higher interest rates and prices are pressuring demand for housing.
Key Points for the Week
- Supply chain issues weighed on second-quarter GDP and the June housing market.
- U.S. real GDP grew 6.5% annualized, capping a strong first half of growth, but the second quarter fell short of expectations.
- June PCE inflation rose 4.0% last year, although numbers came in below expectations.
Inflation increased 4.0% in the last year, supported by a 0.5% increase last month. Rapid inflationary gains are showing signs of slowing. Core inflation, which excludes food and energy, rose 0.5%, but missed expectations. The rate of increases also slowed.
Stocks dipped slightly last week. The S&P 500 slipped 0.4% as did the MSCI ACWI. The Bloomberg BarCap Aggregate Bond Index increased 0.2%. The decline last week reversed the overall monthly trend. The S&P 500 rose 2.4% in July. The U.S. employment report leads a series of key economic releases this week.
Figure 1
The Recovery Continues
The U.S. economy continues to recover from the pandemic. U.S. gross domestic product rose 6.5% on an annualized basis in the second quarter. The strong growth just edged the 6.4% growth in the first quarter. The U.S. economy had been growing just below 2% annually prior to the pandemic. The high rate of growth the last two quarters reflects the broader trend toward reopening, which is providing people more options to spend money.
While 6.5% growth is very rapid, the economy grew slower than expected. Economists predicted the economy would grow 8.5%, and falling short by 2.0% is a large miss. A deeper look into the data suggests the economy performed roughly at expectations except for weakness in three categories that are likely to be made up in future quarters.
Inventories were the biggest detractor from GDP. Consumers and businesses are spending money, but companies aren’t producing new goods quickly enough to replace all those sold. Inventories dropped an annualized 1.1% in the second quarter after a larger 2.6% decline in the first quarter. Housing also shrank as high prices and shortages of key inputs cut back on overall activity. Federal government spending dipped 0.4% from the previous quarter. Adding those three factors increases growth to the target 8.5%.
The lower-than-expected growth this quarter will likely boost growth in coming quarters. Because inventories have shrunk, pressure is building to increase production to make up for the current low levels. Removing supply chain bottlenecks and expanding hiring are key to rebuilding inventories. Issues with semiconductor manufacturing have slowed automobile production levels. Demand for appliances has also exceeded supply. Hiring to fill vacant positions will also help inventories recover as supply can catch up with demand.
While some areas of the economy are wrestling with shortages, consumers propelled the economy higher. Consumption rose 7.8% as people spent more on services. About two-thirds of the contributions came from services spending and the rest from goods.
Some of this jump in consumer spending stems from various stimulus checks provided in previous quarters. While the last major direct payments were sent out in March, not every American was able to spend the money quickly. The economic boost from past checks will continue to fade. Getting people back to work is central to supporting ongoing growth.
While quarterly growth gives us excellent insight, some longer-term measures can lend further perspective. With the recovery this quarter, the U.S. economy is now larger than it was before the pandemic. There is still growth that has been lost, but it is 0.8% larger than it was at the end of 2019. One conclusion investors can draw from the data is the U.S. economy remains resilient. Our advice: Stay invested to reap the rewards gained by corporations from this growth.
—
This newsletter was written and produced by CWM, LLC. Content in this material is for general information only and not intended to provide specific advice or recommendations for any individual. All performance referenced is historical and is no guarantee of future results. All indices are unmanaged and may not be invested into directly. The views stated in this letter are not necessarily the opinion of any other named entity and should not be construed directly or indirectly as an offer to buy or sell any securities mentioned herein. Due to volatility within the markets mentioned, opinions are subject to change without notice. Information is based on sources believed to be reliable; however, their accuracy or completeness cannot be guaranteed. Past performance does not guarantee future results.
S&P 500 INDEX
The Standard & Poor’s 500 Index is a capitalization-weighted index of 500 stocks designed to measure performance of the broad domestic economy through changes in the aggregate market value of 500 stocks representing all major industries.
MSCI ACWI INDEX
The MSCI ACWI captures large- and mid-cap representation across 23 developed markets (DM) and 23 emerging markets (EM) countries*. With 2,480 constituents, the index covers approximately 85% of the global investable equity opportunity set.
Bloomberg U.S. Aggregate Bond Index
The Bloomberg U.S. Aggregate Bond Index is an index of the U.S. investment-grade fixed-rate bond market, including both government and corporate bonds.
https://www.census.gov/construction/nrs/pdf/newressales.pdf
Compliance Case # 01097603


